Lower Riverside Value Trend, 9/1/2010
There are many conflicting reports of value trends both published and anecdotal. We decided to take a look at sales data to attempt to separate fact from fiction. In the analysis below, we selected a section of Riverside south of an east-west line just south of 1-95, below which we believe traffic noise influence form the highway generally is absent. Basically ears selected this line, and we included all the area southward. This area was our choice in an attempt to limit value variations to a degree, and this geographic area was kept consistent for all years analyzed.
We focused on sales for the first seven months of each year, from 2001-2010. This allows us to compare these same spring/summer markets over the and entire decade. We used data from the public sales record, that could cooborated with the MLS. From the total pool of sales we dropped sales for which square footage was not reported. We used the sale price per square foot as the unit of comparison, rather than the overall sales price (although the two units or measure are roughly inter supportive in their indications). My thinking was that since houses are growing in size, the per square foot analysis was more useful for a year to year comparison. I think it is more useful to look at what is being paid pound for apples, rather that the change in the price of the average apple is.
The purpose of this analysis is not to set a per square foot price that can be applied to all Riverside homes. As a former appraiser I know this can't be done, since there is wide variation in value per square foot. Homes in Riverside are to different in qualities and size to set a single price that reflects all homes, despite our attempt to choose a reasonably value-consistent geographical area. What the analysis is useful for is detecting a trend from year to year. That is the goal.
Also, I have adjusted the data by removing the high and low extremes, to yield a result more indicative of the body of the data, and therefore less influenced by anomaly sales. Examples of these anomaly sales might be direct waterfront property, or small tear-down homes on nice lots.
In this example below, we adjusted the data by removing the 3 highest and three lowest sales from the analysis for 2010.
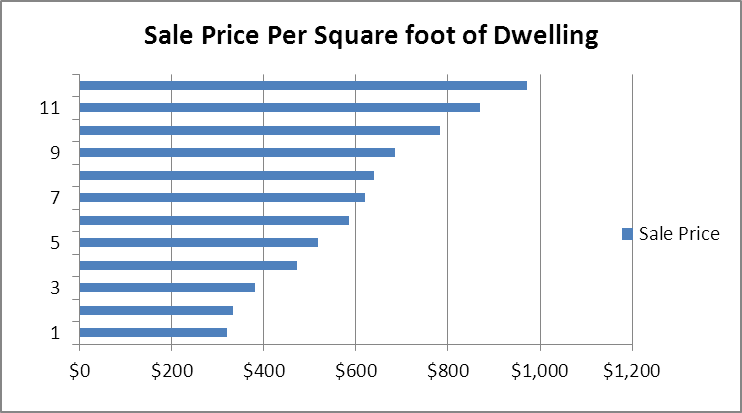
We repeated this procedure for the other 9 years of the analysis.
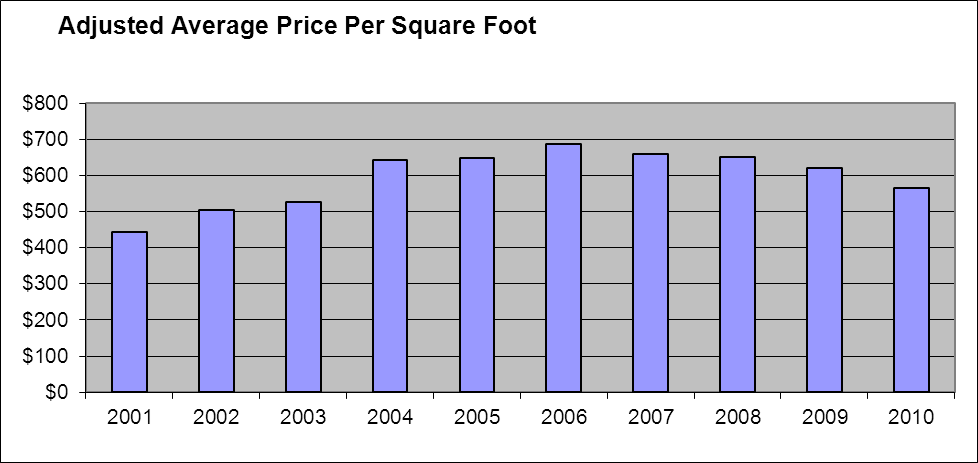
Below are the sale price averages (again not indicative of the value of any particular home) charted over the last decade. As expected, our current adjusted 2010 price average falls is most closely comparable to average adjusted 2003 values. This suggests it is face that 2010 home values have dropped to 2003 levels.
However, inflation needs to e considered. When adjusted for inflation over the decade (converted to 2001 dollars), we can see that values in our study area in lower Riverside are current suggest a 2001 cost equivalency:
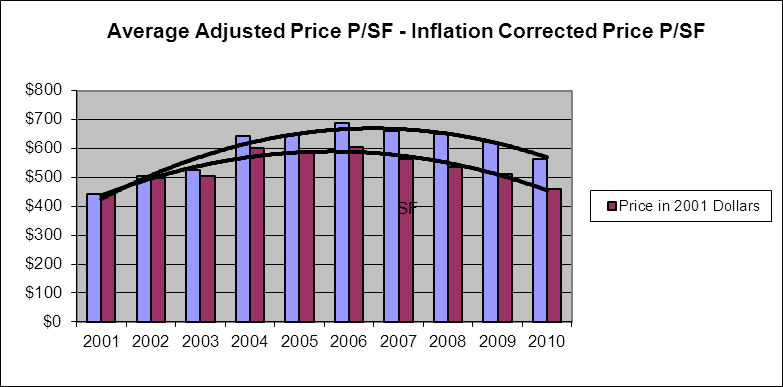
Since 2003 dollars are worth less that 2001 dollars, we can see that the real underlying costs of homes in 2010, is quite similar to the 2001 level (when dollar value is equalized)..
Given that current interest rates which are lower than in 2001... it is arguable that real estate available in 2010 can be purchased at an actual monthly cost equivalency less than that of 2001.
THE QUESTION IS...Where are values going? Will prices get better?
The influence of the national factors are anyone's guess, but I cannot ignore sales volume as an indicator (the numbers of homes sold over a given time). Below is a chart showing what sales volume looked like over the decade in our study area: 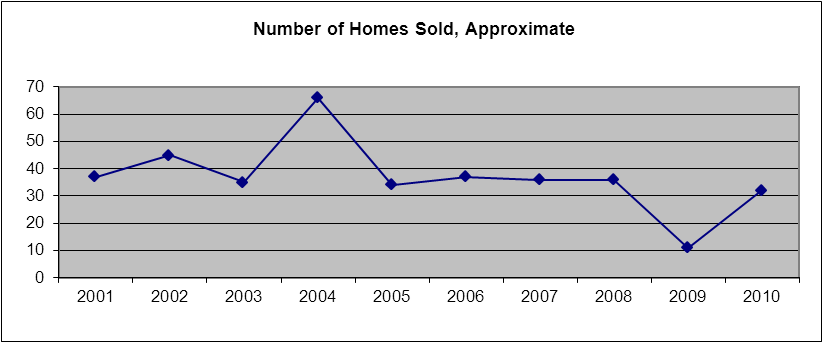
The higher volumes sold in the 2003-2005 spike reflect the value increase that gained momentum. Although the underlying pressure for price increases started to ease off in 2005, the momentum continued for another year or so.
The dip in 2009 is indicative of the difficult year real estate experienced. What is also interesting here, is the relatively quick bounce back we have had from 2009 to 2010. Although prices have not increased, buyers and sellers are coming to agreements. The increase in 2010 volume over 2009 in our study area reflects a similar significant increase in sales for the town overall.
I am are reluctant to say it out loud... but when buyers and sellers agree, and do so in an increased volume of transactions, it is hard to avoid the conclusion that buyers are becoming comfortable with price levels. So although it is still a buyers market, it may be gradually become less so.
Does this mean we that prices may soon be regarded as having stabilized?
It cannot be known for certain, but, this does constitute support for that projection. I will be interesting to run this analysis again in July of 2011.
- John Herman Exclusive Buyer Agent
Also See: BackCountry Analysis; MidCountry Analysis